Welcome to progress post 3!!!! There is no mistake that progress is bold because we have made some serious progress!!!!!!!!!!!!!!!!!!!!!!!!!!!!!!!!!!!!!! So sit back, relax and prepare to read about how I have combined Garmin Data and excel to achieve the ultimate running statistic feedback system!!!!!!
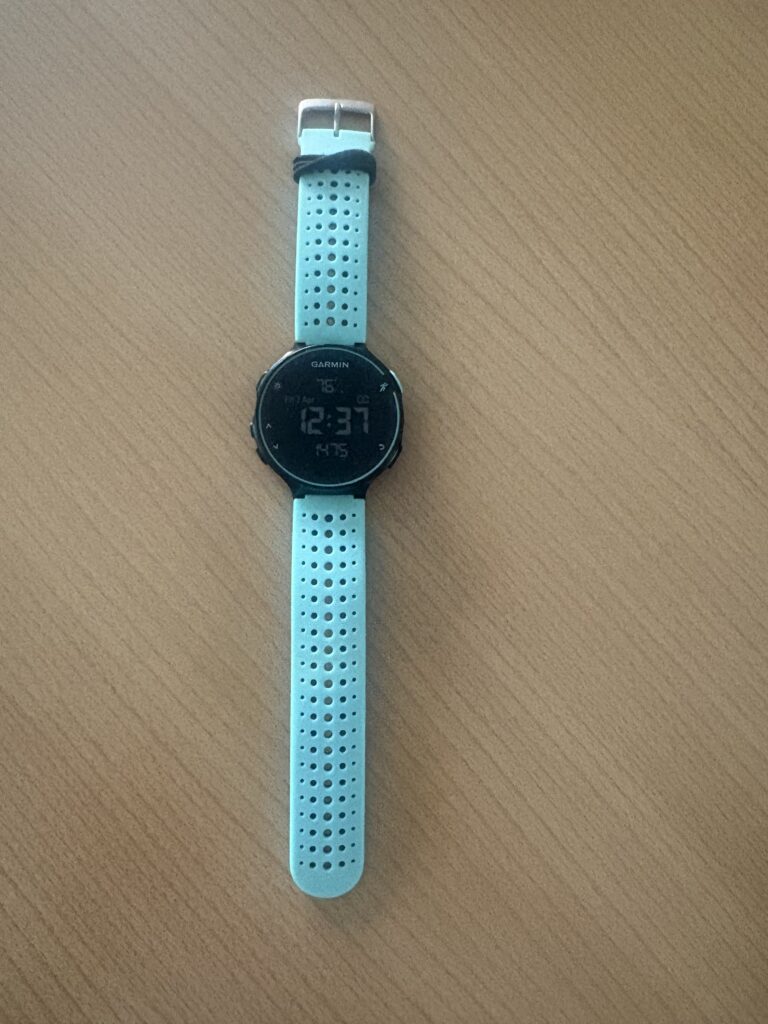
I took my easy recovery run from the other day and actually tracked the data using my friend’s Garmin watch which he is in the process of selling. My original plan for this project was to use a Garmin watch my dad had given to me which was gifted to him from some tri-club friends however to our shock it was actually a bike computer which ended up delaying the process a little bit as I have been wanting to track my runs with something either then my phone for a while. I run about 70km a week and at the level it is definitely beneficial to have advanced statistics. Thankfully my friend lent me his watch for the week so it’s time to start tracking!
I will display what I learned in a step by step process in order to make it as simple as possible for anyone trying to follow in my footsteps!!!! Keep in mind this is not my final step by step process as I have identified issues which I plan to fix by my final process guide.
The first step is to set up a Garmin Connect account and connect your watch to your profile using Bluetooth. Once this is done, start your run while tracking on the watch. When you finish your run, save it and some activity summary statistics will appear which are helpful but doesn’t show as much as one may want.
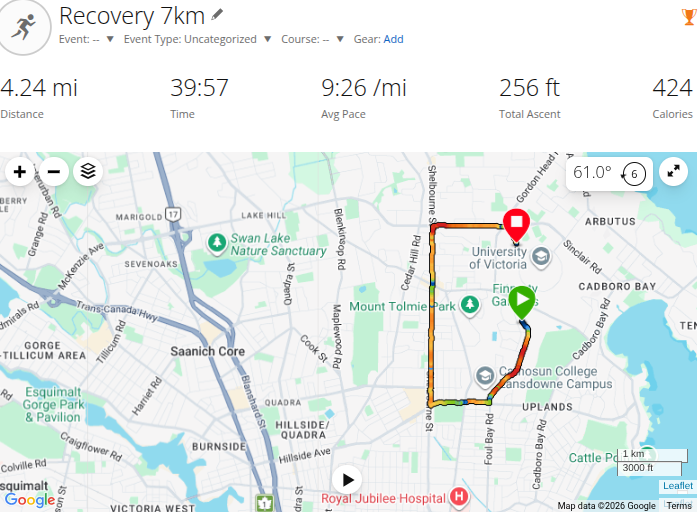
The next step is to login to your Garmin Connect account, click activities, select all activity”s and find today’s run. It will likely have some generic name, mine was “Oak Bay Run”, feel free to change it to whatever (I changed mine to Recovery 7k). Click on that activity and it will have more stats then what the watch displayed but we’re still not at the point we want to be.
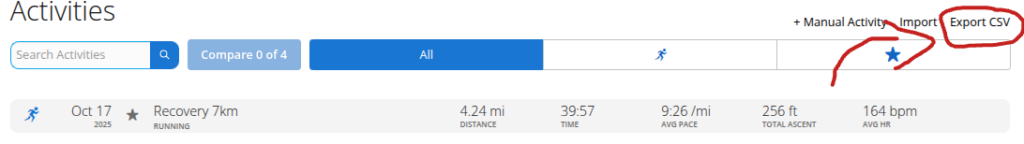
Step 3 is where things get awesome. Click on the “CSV” button, download the CSV file and then go to open it by clicking “Export CSV”. Open it in a new excel booklet and your data awaits you!!!!!! We now have data from the run but now its time to make sure we properly analyze it.
For step 4 we want to organise the data so it is easy to read. I am going to delete the data under “favourite” as I have deemed it not necessary for what my goal is. To do this highlight favourite and the data under it, click (control, -) on your keyboard and then select shift cells left. This will get rid of that data and shift the rest of the data to fill its spot. The next thing I had to do for my data was switch it from Miles to Kilometers, I think that most people will have made this switch on their Garmin watch already but I did not think of that before this run. So if like me you are in miles and want kilometers all you have to do is select an empty cell and use the function “=convert((cell that you want converted), “mi”, “km”)” and the conversion will be made, replace the miles value with your new kilometer value! Once you’re done make sure all your data looks correct before moving on to step 5. Your data should like the image below this.

Step 5 is where I am what am I still working on. I have been experimenting with different types of charts to try and find the most optimal chart combination to display your running data. So far from what I can tell it is probably going to be some type of combo chart as that is the closest I’ve come to creating something aesthetically pleasing. While I have yet to find a chart I am satisfied with, I am continuing to work towards creating something amazing specifically using tools from the Excel Workshop I took from the UVic Library. I would then like to make a full manual or maybe even an Excel template that anyone can follow similar to what I’ve started this blog post.
With where we are leaving off for now you have your Garmin data in excel displaying all your relevant stats from your run. Awesome!!! I genuinely think I am close to designing a chart that effectively and neatly displays ones running statistics I just need to spend more time researching and trying things. I learned most of the skills needed to display this data in the UVic Excel Course and would highly recommend it to anyone trying to build similar skills.
While the data itself is relevant, I am concerned with some of the data values not making sense. Mainly my heart rate compared to my pace. Garmin claimed I had an average pace of 5:52 minutes per kilometer which seems realistic to me but my average heart rate was 164. In my current shape I can run 5km in 19 minutes and 39 seconds, therefore at 5:52 pace my heart rate should be anywhere from 130-150 but not 164 with spikes of up to 180. This could be either because there is something wrong with the watch’s settings or I am very fatigued from my training. I have no idea which is the cause but I am determined to find out and will research to hopefully have an answer by my next post as sort of a side project!!!!
I hope you enjoyed this progress report and make sure to stay tuned for further progress on my tutorial as well as personalizing my Garmin data in the near future!!!!!!
2026-04-12 at 6:19 pm
Liam this is awesome!! keep the running up I love to see it!