Welcome to the 2nd progress post as I combine my marathon training with excel. I have completed the Excel workshop from UVic library and with that its time to put what I’ve learned to the test in my running documentation project.
The workshop is split into 4 introductory parts. Part 1 was made up of fundamental skills, this was the only section of the workshop I was already well versed in prior to taking the workshop. Part 2 of the workshop consisted was an intro to functions which consisted of functions I already knew but also brand new functions which are going to be very helpful moving forward! The third introductory step Statistical Functions is what I believe will be most useful for my assignment as well as my life moving forward. I am in Statistics 252 right now and actually already understood most of the terms used in the workshop however I was unaware of how they can be used in excel and I ended up playing around with the Analysis Tool Pak trying to find ways to apply it to my running. The final part of the introduction section of the workshop was the charting and graphing section which I was actually mostly familiar with but still learned valuable info like how to freeze rows which definitley could’ve helped on some of my Stats 252 labs that use excel.
Following the introduction part of the workshop there were two more parts which were considered intermediate skills. The first intermediate skill was creating pivot tables. These tables which I was previously unfamiliar with allow you to group items or rows into catagories in which you can then count the catagories to get sums, averages and keep your data organized. Very useful!!! The other intermediate skill was creating a digital dashboard, this allows you to summarize and vizualize data which is pretty awesome. They can made up of any sort of chart, formulas or even pivot charts the skill learned previous to it.
I definitley have a better understanding for excel following this workshop. While I have learned excel in my Stats and Econ courses, I have yet to take a formal course like this that walked me through all the parts of excel. I feel as if I am ready to branch out and experiment with new tools in Excel now.
The first thing I did with my running data following this course was turn my training weeks into their own pivot chart. This allowed me to total the weekly Kilometers covered and how much of a type of training day (Long, Tempo Intervals, Easy, Rest) I ran that week.
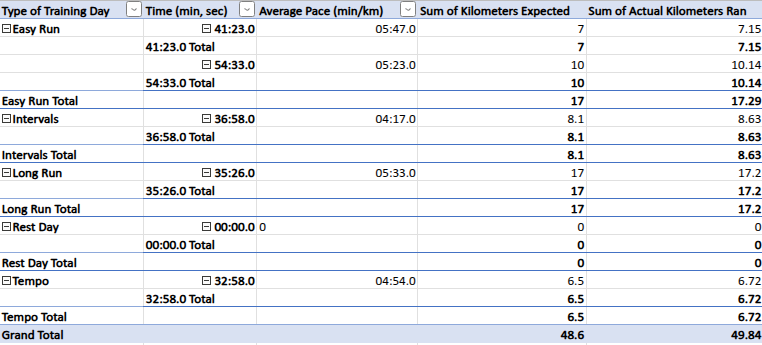
This is one of my pivot tables I described above. By my next post I plan to be able to make much neater and useful tables but as you can see it goes through each type of training and their stats and provides the totals.
The next thing I did to recap the totals of my 3 weeks was make a bar graph of my weekly Km totals throughout the past 3 weeks in which I have recorded.
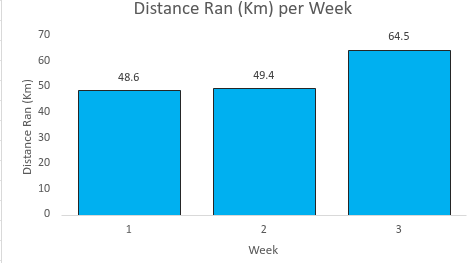
This graph compares and shows the progress of the distance I have run over the past 3 weeks. While I could find a similar graph on the app Strava that I use to track my runs, this allows me to learn how to use Excel while completing something I have genuine interest for which is allowing me to pick up skills quickly.
I believe there will be big progress between now and my next post as there are still plenty of skills from the workshop I have yet to attempt, I have yet to set up Garmin data with Excel and I plan on conducting more research for how to track my data.
Up until now I have learned a lot on Excel through this assignment but it has also helped a lot with me staying committed to my marathon training which I am quite happy about as that means a lot to me! Stay tuned for another update soon where I am hoping to show great improvement!!!!